IOstat is a command-line tool that provides valuable insights into input/output (I/O) statistics for storage devices and partitions on Linux systems. It can be used to monitor system performance, identify potential bottlenecks, and troubleshoot I/O-related issues.
In this article, we’ll discuss how to interpret the output of IOstat and explore some scenarios where it can be useful.
Examining IOstat Output IOstat output can be a bit overwhelming at first, but understanding the meaning of each column can help you make sense of the data. Here’s an example of IOstat output:
Device:         tps      kB_read/s   kB_wrtn/s  kB_read   kB_wrtn
sda             1.00     0.00        8.00       0         8
sdb             3.00     56.00       0.00       56        0
sdc             4.00     80.00       0.00       80        0
Here is a much comprehensive one:
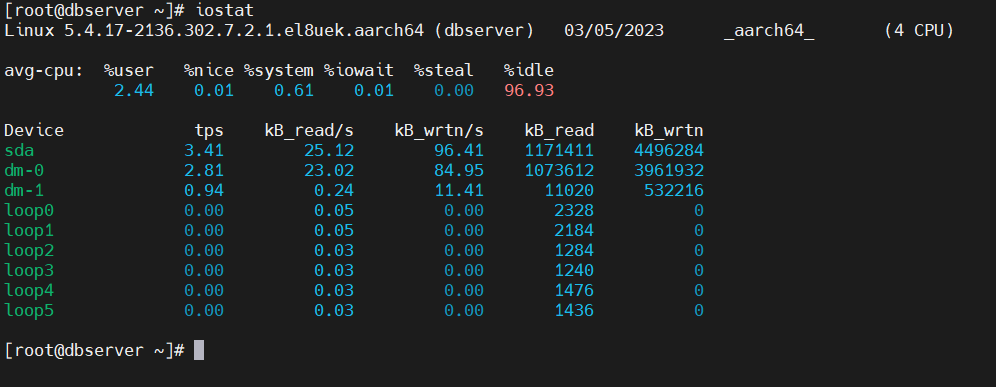
The first column shows the device or partition name, followed by several columns representing different metrics:
- tps: Transactions per second – the number of I/O transactions per second
- kB_read/s: Kilobytes read per second
- kB_wrtn/s: Kilobytes written per second
- kB_read: Total kilobytes read from the device
- kB_wrtn: Total kilobytes written to the device
To make sense of this output, you can look for devices with high values in the tps column, which can indicate that a device is heavily utilized and may be a bottleneck. High values in the kB_read/s and kB_wrtn/s columns can indicate heavy read and write activity on the device, respectively.
You can also examine the total number of kilobytes read and written (kB_read and kB_wrtn) to get an idea of the overall I/O activity on the device over time. Keep in mind that IOstat output is just a snapshot of I/O activity at a single point in time, so you may want to run IOstat over a longer period to identify trends in the data.
IOstat Metrics Explained Let’s take a closer look at the metrics displayed in IOstat output:
- Transactions per second (tps) The tps metric represents the number of I/O transactions performed on a storage device or partition per second. Each transaction can involve multiple blocks of data, so tps doesn’t necessarily correspond to the number of kilobytes transferred per second.
A high tps value can indicate heavy I/O activity on a device, which can lead to performance issues or other problems. Monitoring tps values over time can help you identify trends and potential issues.
- Kilobytes read per second (kB_read/s) The kB_read/s metric shows the number of kilobytes read from a storage device or partition per second. This metric can be used to monitor read activity on a device.
High values in this column can indicate that a device is being heavily utilized for read operations, which could potentially lead to performance issues or other problems.
- Kilobytes written per second (kB_wrtn/s) The kB_wrtn/s metric shows the number of kilobytes written to a storage device or partition per second. This metric can be used to monitor write activity on a device.
High values in this column can indicate that a device is being heavily utilized for write operations, which could potentially lead to performance issues or other problems.
- Total kilobytes read (kB_read) The kB_read metric shows the total number of kilobytes read from a storage device or partition since the device was last initialized. This metric can be used to monitor the