The iostat command is a powerful tool that provides system administrators with detailed information on the input/output (I/O) performance of storage devices and partitions on a Linux system. With the “-x” option, iostat generates an extended report that provides even more detailed information than the default iostat output.
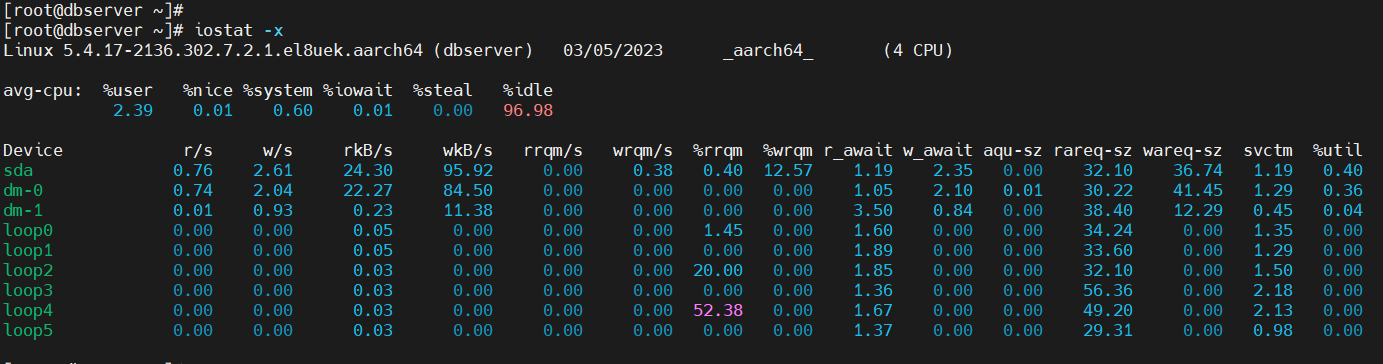
The extended report provided by iostat -x includes a variety of metrics that are useful for assessing I/O performance. One of the most important metrics is “%util”, which measures the percentage of time that a storage device or partition is busy servicing requests. Devices with high values in this column are likely being heavily utilized and could be potential bottlenecks in the system.
Another important metric provided by iostat -x is “await”, which measures the average amount of time (in milliseconds) that a request takes to be serviced, from the time it is added to the queue until it is completed. High values in this column can indicate that there is a high latency between the time a request is added to the queue and the time it is completed, potentially impacting system performance.
The “avgrq-sz” metric measures the average size (in sectors) of the requests sent to the device. A higher value for this metric indicates that the system is sending larger requests to the device, which can improve performance by reducing the overhead associated with sending multiple smaller requests.
The “avgqu-sz” metric measures the average queue length of requests waiting to be serviced by the device. High queue lengths can also indicate potential bottlenecks in the system, as they suggest that there are many requests waiting to be serviced.
The “r/s” and “w/s” metrics respectively measure the number of read and write requests that are being issued to the storage device or partition per second. A higher value for r/s indicates that the system is reading data at a faster rate, while a lower value indicates that data is being read more slowly. Similarly, a higher value for w/s indicates that the system is writing data at a faster rate, while a lower value indicates that data is being written more slowly.
In addition to these metrics, iostat -x also provides information on merged read and write requests. When multiple read or write requests are merged together into a single request, it can improve overall performance by reducing the overhead associated with sending multiple smaller requests. The “rrqm/s” and “wrqm/s” metrics respectively measure the number of merged read and write requests that are being sent to the storage device or partition per second.
Overall, the iostat command with the -x option provides system administrators with a powerful tool for assessing the I/O performance of storage devices and partitions on a Linux system. By analyzing the various metrics provided by iostat -x, system administrators can identify potential bottlenecks in the system and take steps to optimize I/O performance.